

Table of contents
- This episode: Amazon CloudWatch and observability. In this Hello, Cloud blog series, we're covering the basics of AWS cloud services for newcomers who are .NET developers. If you love C# but are new to AWS, or to this particular service, this should give you a jumpstart.
- Amazon CloudWatch : What is it, and why use It?
- Our Hello, CloudWatch Project
- Where to Go From Here
- Further Reading
This episode: Amazon CloudWatch and observability. In this Hello, Cloud blog series, we're covering the basics of AWS cloud services for newcomers who are .NET developers. If you love C# but are new to AWS, or to this particular service, this should give you a jumpstart.
In this post we'll introduce CloudWatch and use it to monitor a "Hello, Cloud" .NET application. We'll do this step-by-step, making no assumptions other than familiarity with C# and Visual Studio. We're using Visual Studio 2022 and .NET 6.
Amazon CloudWatch : What is it, and why use It?
"For some must watch, while some must sleep. So runs the world away." —William Shakespeare
Any serious cloud application requires observability and monitoring. Is your application up or down? Is it purring along happily, experiencing occasional errors, or spewing constant errors at an alarming rate? Is it upholding your service level agreement to your customers? How's performance? Are you about to exhaust a resource? Observability is insight into the state of your application and infrastructure, and is how you answer these kinds of questions. Without observability, your software is an opaque black box and you won't have a clue about how it's doing or what is causing a problem.
You can't have observability without monitoring, the gathering and surfacing of data that makes observability possible. Put another way, monitoring tells you when something is wrong, while observability helps you understand why and take action. The three pillars of observability are metrics, tracing, and logging. Metrics can be aggregated, logging deals with discrete events, and tracing is scoped to an individual request.
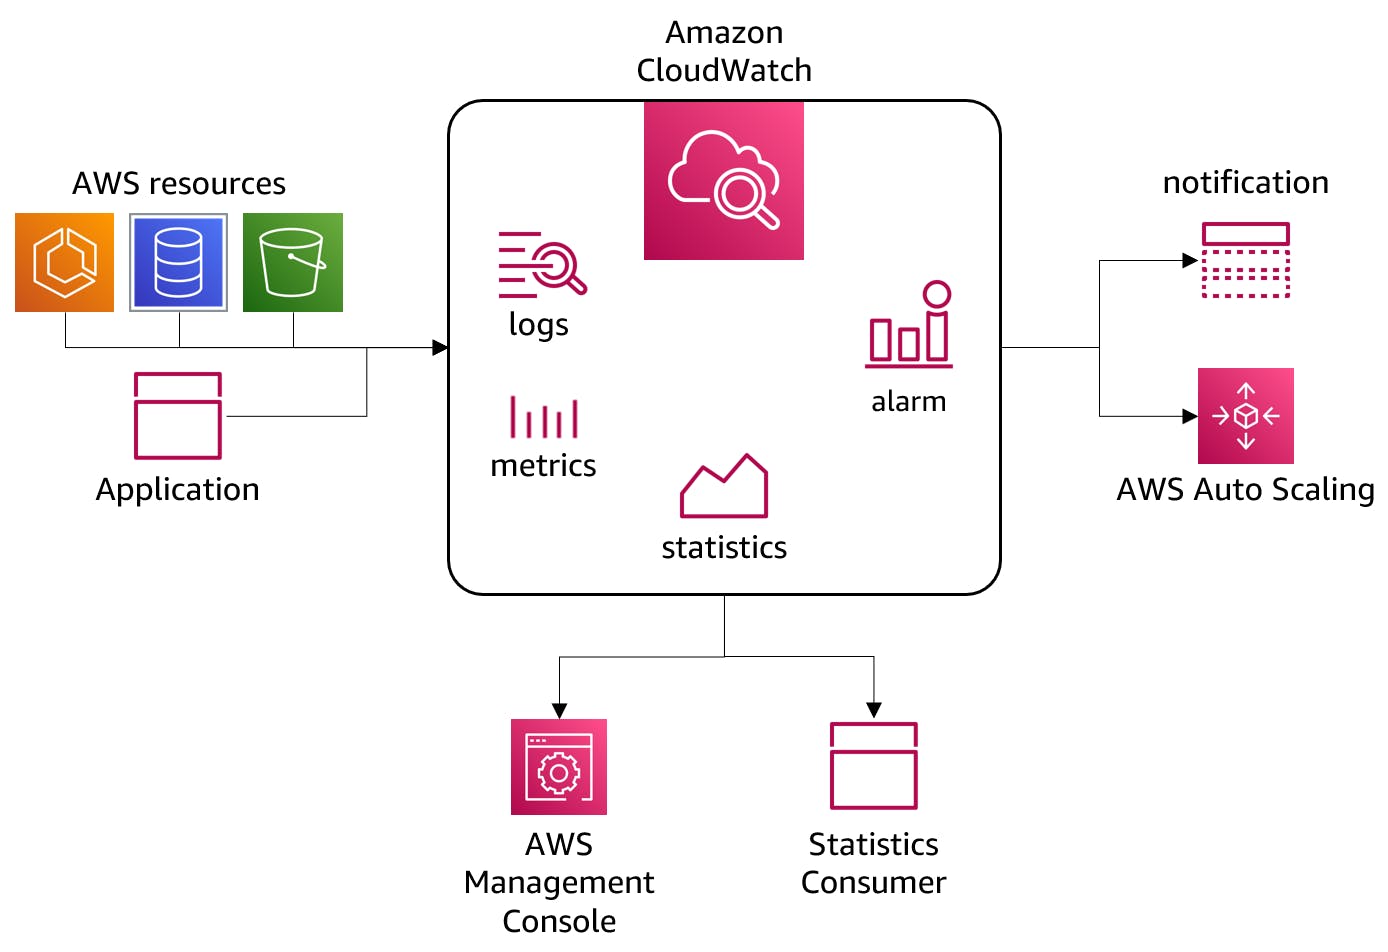
Amazon CloudWatch (hereafter "CloudWatch") is a service that provides both monitoring and observability for your applications. AWS describes it as "a monitoring and observability service that provides you with data and actionable insights to monitor your applications, respond to system-wide performance changes, and optimize resource utilization". CloudWatch monitors your applications and collects data in the form of logs and metrics. It calculates statistics and generates events.
You can use CloudWatch as a unified observability platform. It integrates with over 70 AWS services, including Amazon EC2, Amazon DynamoDB, Amazon S3, Amazon ECS, Amazon EKS, and AWS Lambda. In addition to AWS applications, you can monitor on-premise applications by installing a CloudWatch agent or using the CloudWatch API.
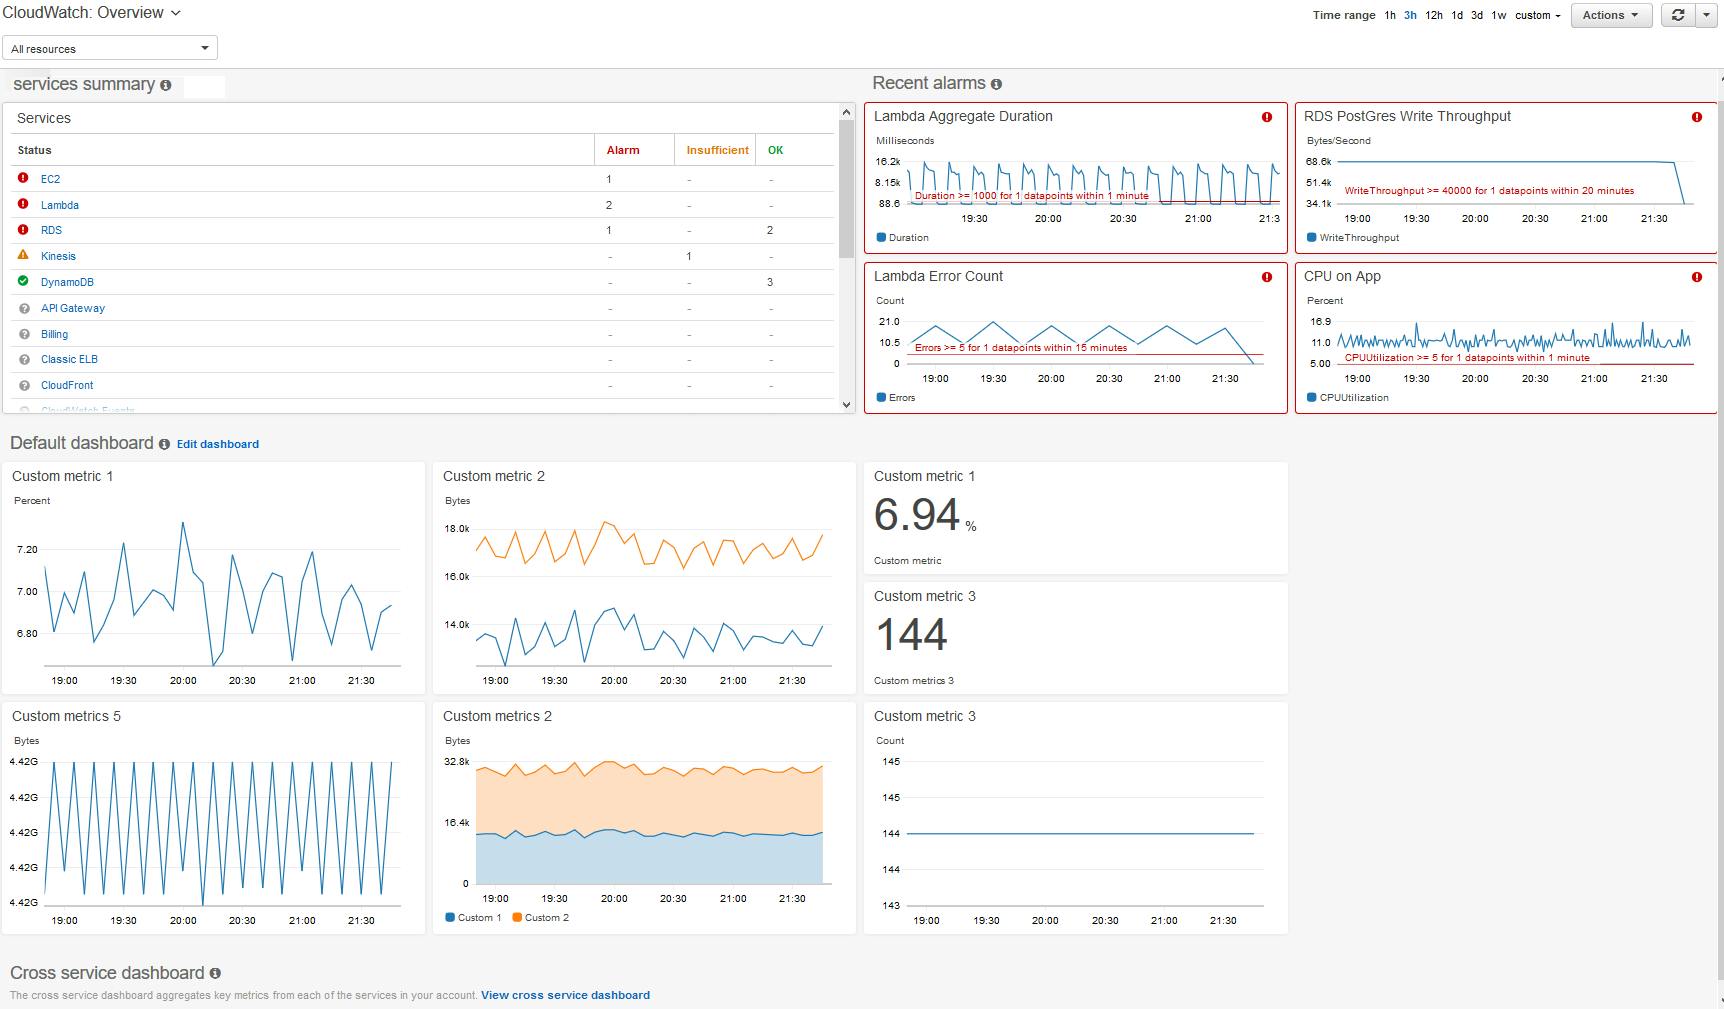
CloudWatch has automatic dashboards that give you an operational view of real-time and historical data, with one-second granularity. You can retain metrics for up to 15 months. When you view CloudWatch in the AWS management console, you see a list of services in your account and alarms, a default dashboard you can create, and an optional cross-service dashboard if you use six or more AWS services.
CloudWatch performs these activities:
- Collect: CloudWatch collects metrics and logs from AWS or on-prem resources, applications, and services.
- Monitor: CloudWatch provides visualizations of apps and infrastructure in CloudWatch dashboards.
- Act: You can automate responses to operational changes using CloudWatch events, which can emit notifications or engage AWS auto-scaling.
- Analyze: You can analyze real-time and historical data. You can calculate derived insights across multiple metrics using CloudWatch Metric Math.
CloudWatch offers monitoring at two levels, basic and detailed. In addition to free basic monitoring, review the AWS Pricing Page for paid rates and free tier offerings, including handy pricing examples. Many applications can operate within the free tier limits.
- Basic monitoring: Many AWS services automatically publish default metrics to CloudWatch at no charge.
- Detailed monitoring: Some AWS services offer detailed monitoring, which you must explicitly enable.
For your own applications, CloudWatch will track logs and metrics for many AWS services you use. In addition, your .NET applications can publish logs and custom metrics to CloudWatch. You can write logs to CloudWatch or query CloudWatch with the AWS SDK for .NET. You can integrate a variety of popular .NET logging systems to CloudWatch, including Apache Log4Net, ASP .NET Core Logging, NLog, and Serilog (see blogs and videos listed at the end of this post). AWS provides plug-ins for these logging systems in the AWS Logging .NET repository.
Our Hello, CloudWatch Project
We will create a simple .NET website and instrument it for logging with the AWS Logging .NET plug-in for ASP .NET Core Logging. We'll host our website in AWS App Runner. As we use the website, we'll view the logs and metrics in CloudWatch.
One-time Setup
For any of the tutorials in the Hello, Cloud series you need the following:
- An AWS account, and an understanding of what is included in the AWS Free Tier.
- Microsoft Visual Studio 2022. If you're using an older version of Visual Studio you won't be able to use .NET 6. If you use a different IDE, you may have to find alternatives to some tutorial steps.
- AWS Toolkit for Visual Studio. You'll need to configure the toolkit to access your AWS account and create an IAM user. Your default AWS profile will be linked to this user when running programs from the command line.
Step 1: Create Web Project
In this step, you'll create a .NET 6 web project, add the AWS logging plug-in for ASP .NET Core Logging, and test the program locally.
Open a command/terminal window and CD to a development folder.
Run the
dotnet newcommand below to generate a web application namedhello-cloudwatch.dotnet new webapp -n hello-cloudwatch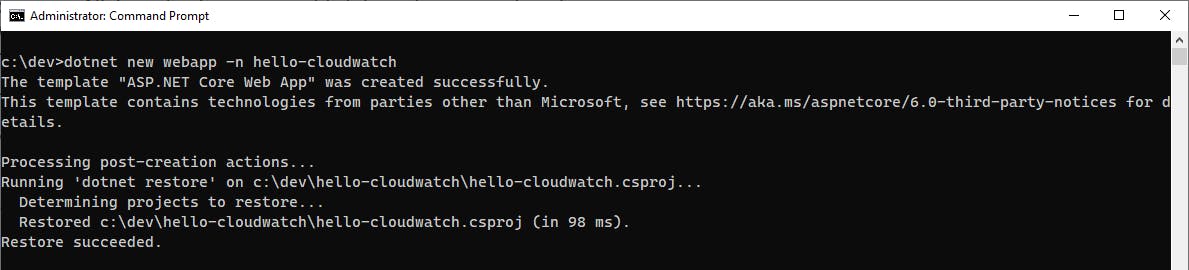
Launch Visual Studio and open the hello-cloudwatch project.
In AWS Explorer, select the region you want to work in, which must support AWS App Runner and CloudWatch. We're using us-west-2 (Oregon).
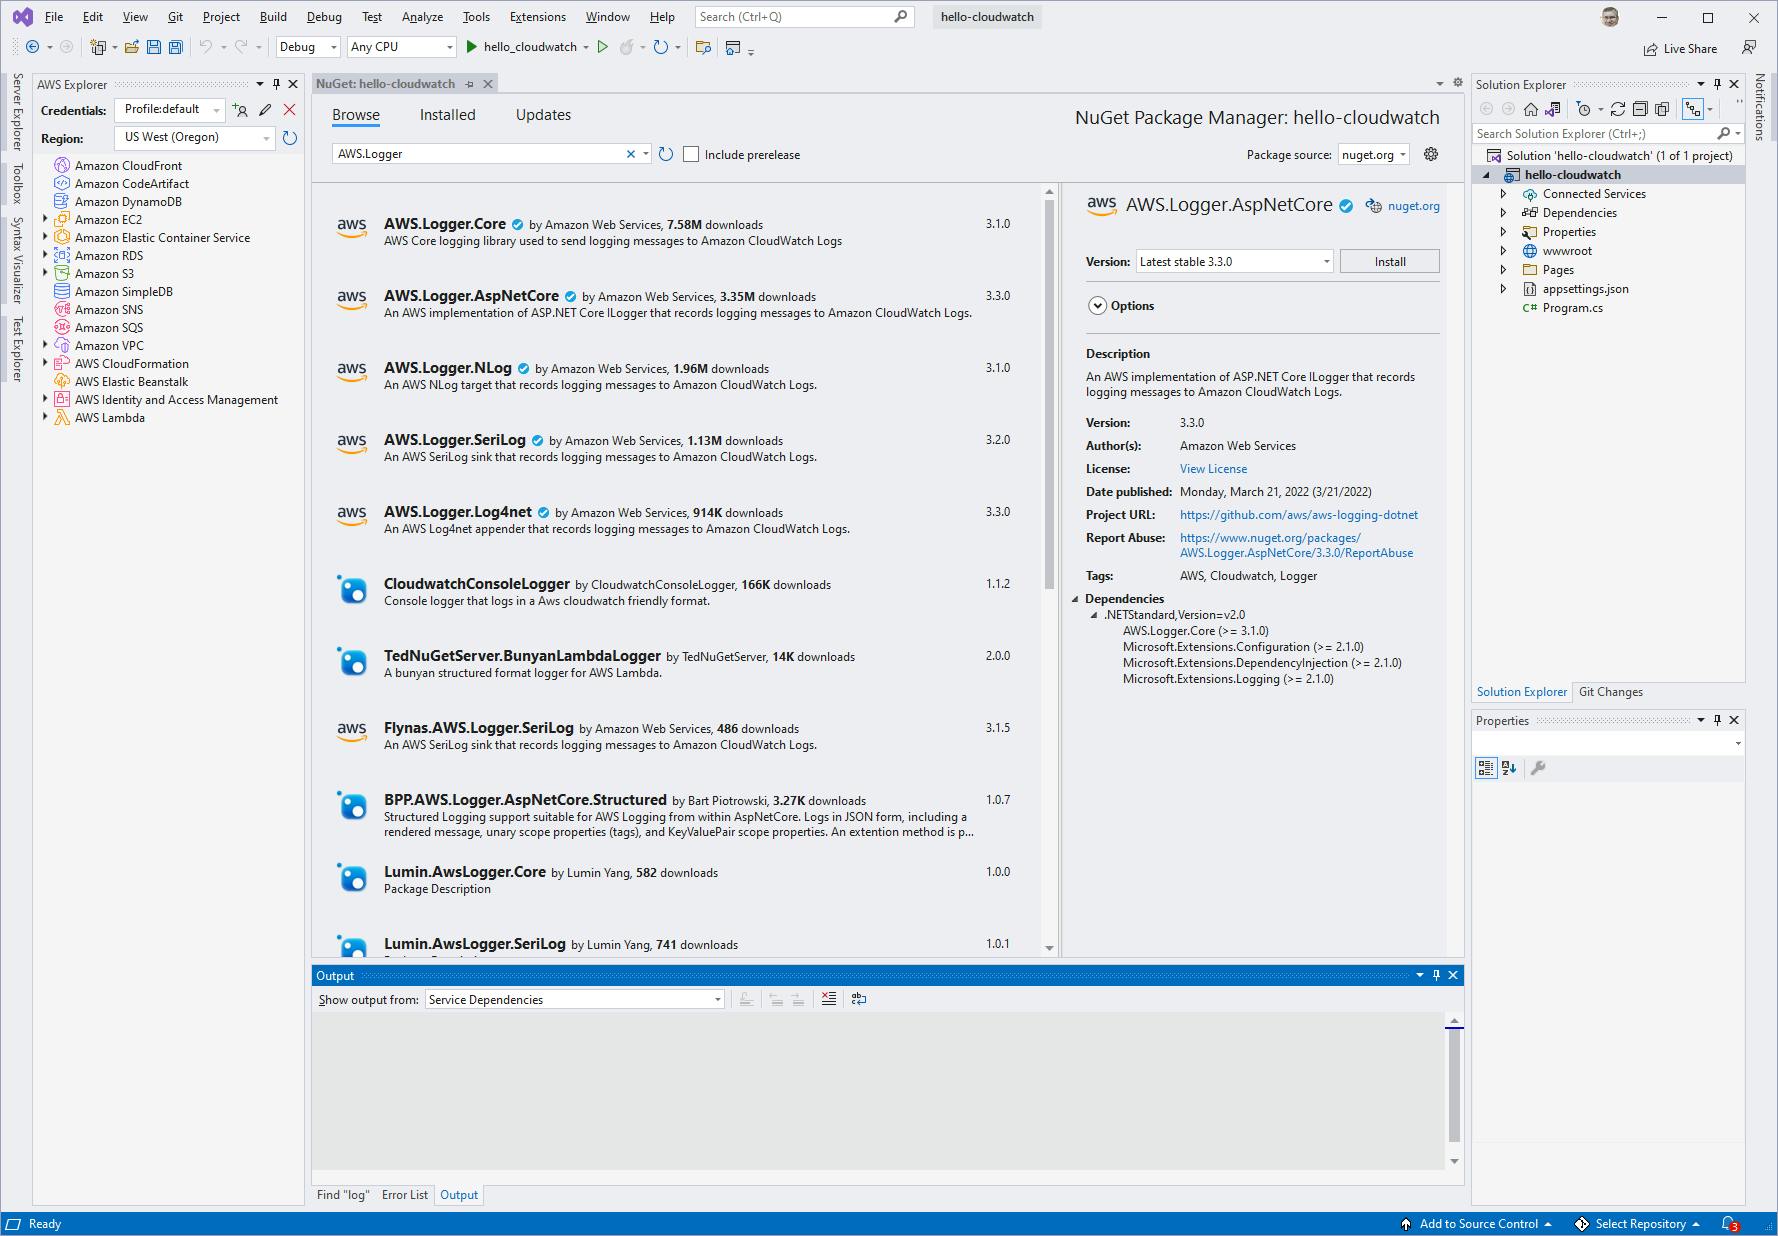
Install the AWS.Logger.AspNetCore NuGet package:
A. In Solution Explorer, right-click the hello-cloudwatch project and select Manage NuGet Packages....
B. Search for and install the AWS.Logger.AspNetCore package.
Open Program.cs in the code editor. At line 5, below the
builder.AddRazorPages();statement, add the statement below to add the AWS logging provider for ASP .NET Core Logging:builder.Logging.AddAWSProvider();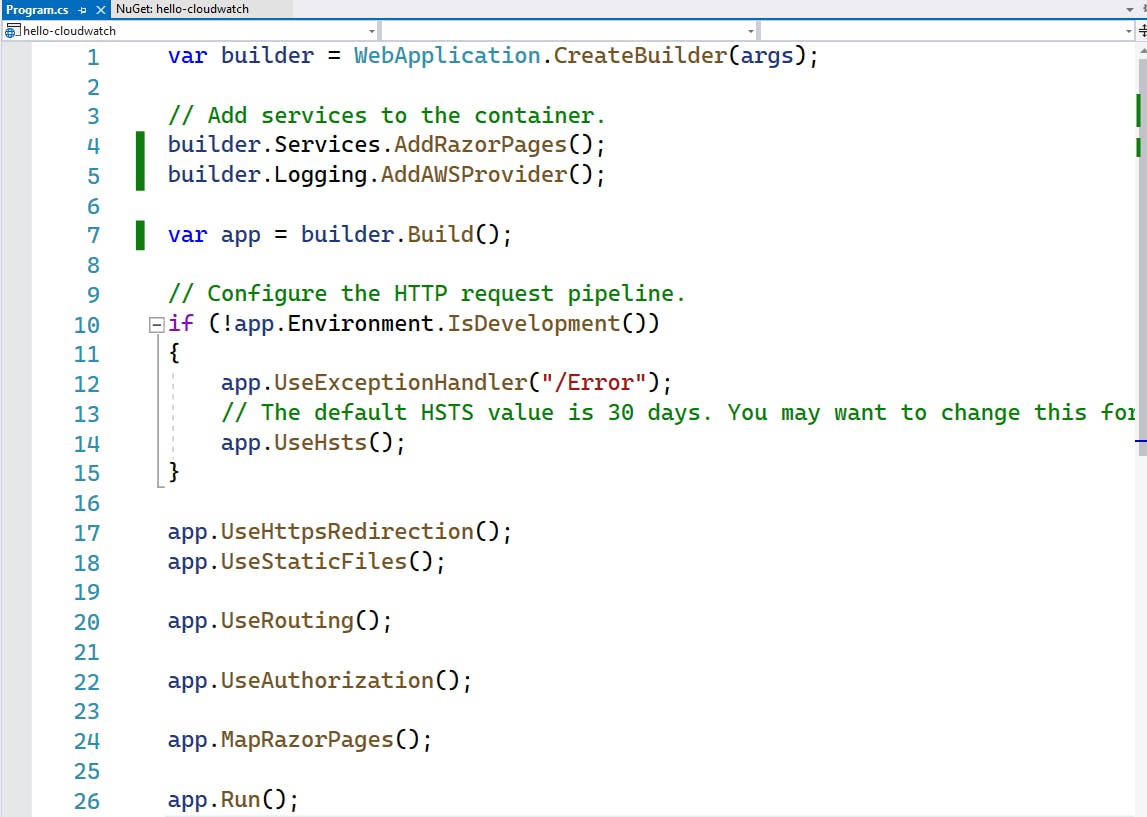
Create an Add page that can add two numbers.
A. In Solution Explorer, under the Pages folder, make a copy of Index.html named Add.html, such that you end up with Add.html and Add.html.cs.
B. Open Add.cshtml.cs in the code editor, and replace it with the C# code below at the end of this step. This code gets two parameters from the web path, n1, and n2, and adds them. The model makes properties N1, N2, and Sum available to the Razor page. There are two
_logger.LogInformationstatements to write to the log. ASP .NET will also write log messages.C. Open Add.cshtml in the code editor, and replace it with the Razor page code below at the end of this step. This page shows the two numbers passed on the web path and the calculated sum, via the model variables N1, N2, and Sum.
Open the appsettings.json file, and add the configuration for CloudWatch shown at the end of this step.
Save your changes and build the program.
appsettings.json
{
  "Logging": {
    "Region": "us-west-2",
    "LogGroup": "AspNetCore.hello_cloudwatch",
    "IncludeLogLevel": true,
    "IncludeCategory": true,
    "IncludeNewline": true,
    "IncludeException": true,
    "IncludeEventId": false,
    "IncludeScopes": false,
    "LogLevel": {
      "Default": "Debug",
      "System": "Information",
      "Microsoft": "Information"
    }
  }
}
Add.cshtml.cs
using Microsoft.AspNetCore.Mvc;
using Microsoft.AspNetCore.Mvc.RazorPages;

namespace hello_cloudwatch.Pages;

public class AddModel : PageModel
{
    private readonly ILogger<AddModel> _logger;
    public int N1 { get; set; }
    public int N2 { get; set; }
    public int Sum { get; set; }

    public AddModel(ILogger<AddModel> logger)
    {
        _logger = logger;
    }

    public void OnGet(int n1, int n2)
    {
        _logger.LogInformation("Add n1={n1}, n2={n2}", n1, n2);
        N1 = n1;
        N2 = n2;
        Sum = n1 + n2;
        _logger.LogInformation("Sum: {Sum}", Sum);
    }
}
Add.cshtml
@page
@model AddModel
@{
    ViewData["Title"] = "Add";
}

<div class="text-center">
    <h1 class="display-4">Add</h1>
    <p>@Model.N1 + @Model.N2 = @Model.Sum.</p>
</div>
Step 2: Test the Program
In this step, you'll run the program locally to test it prior to deployment.
In Visual Studio, press F5 to debug the program locally. A Welcome page opens in a web browser.
Add this to the end of the web address and press ENTER:
/Add?n1=3&n2=5'. You see the Add page display, showing the two parameters (3 and 5) and the computed sum (8).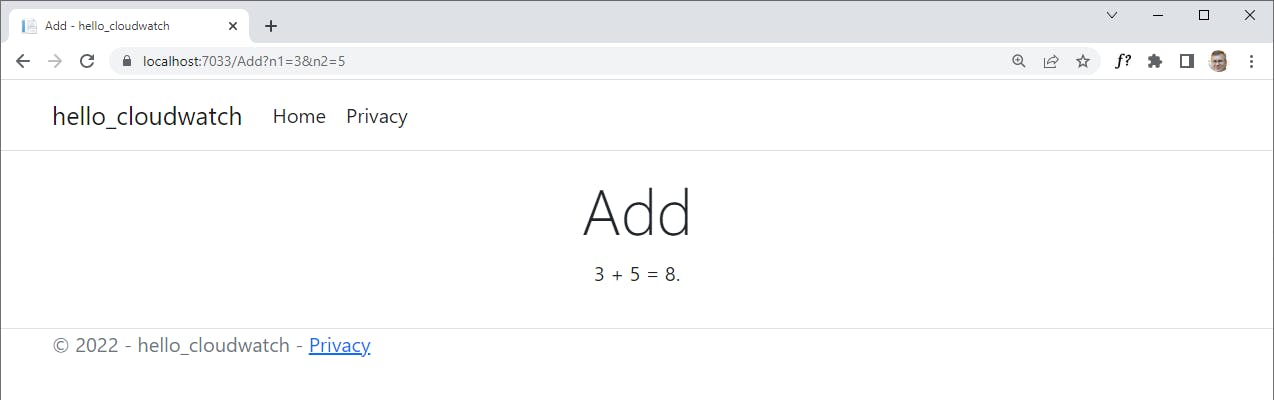
In the Visual Studio output window, you should see evidence that logging is happening:
hello_cloudwatch.Pages.AddModel: Information: Add n1=3, n2=5
hello_cloudwatch.Pages.AddModel: Information: Sum: 8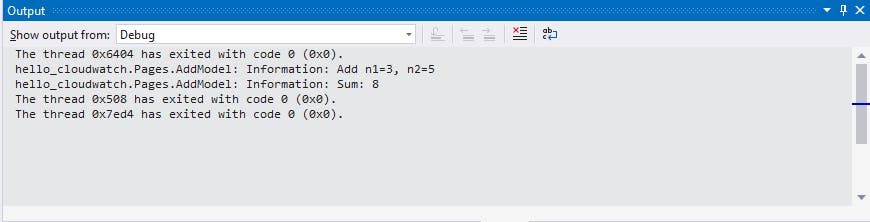
Stop the program.
Even though your app is still local, it is now logging to CloudWatch.
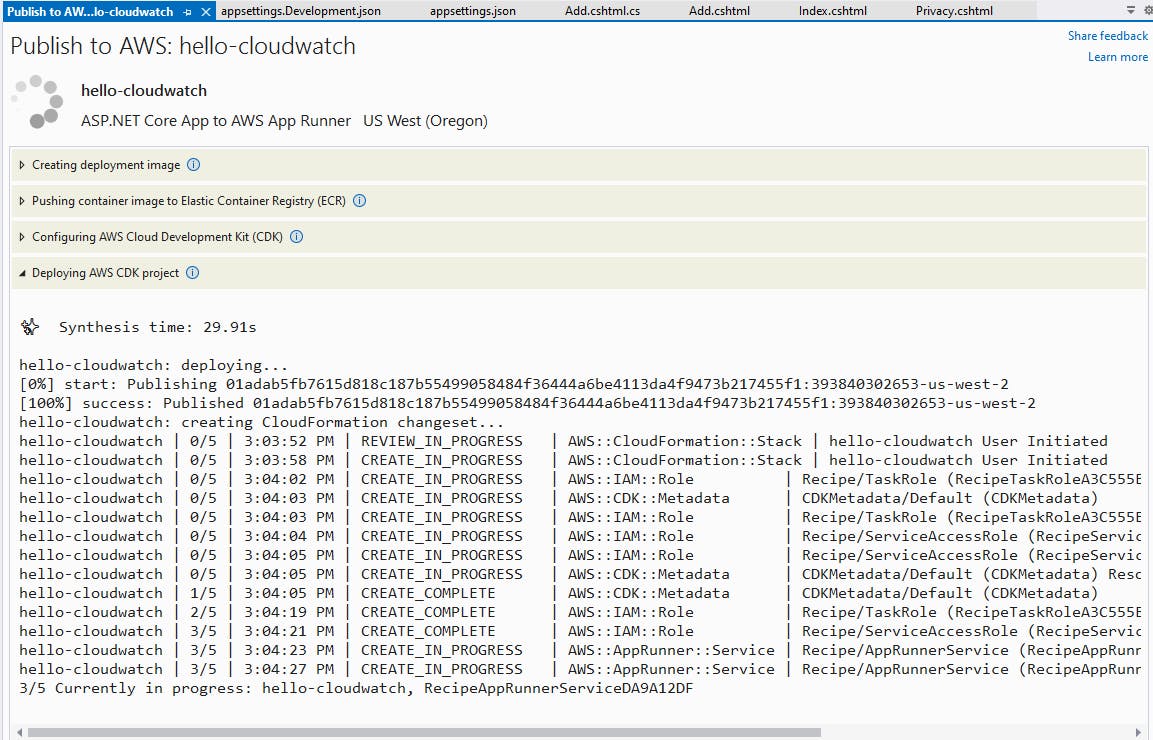
Step 3: Publish to AWS App Runner
In this step, you'll publish the web application to AWS App Runner. We'll do this using the new Publish to AWS experience in the AWS Toolkit for Visual Studio. If you're not using Visual Studio, you can do this from the command line using the AWS deployment tool for .NET CLI.
In Visual Studio Solution Explorer, right-click the
hello-cloudwatchproject and select Publish to AWS.In the Publish to AWS wizard, select ASP .NET Core App to AWS App Runner.
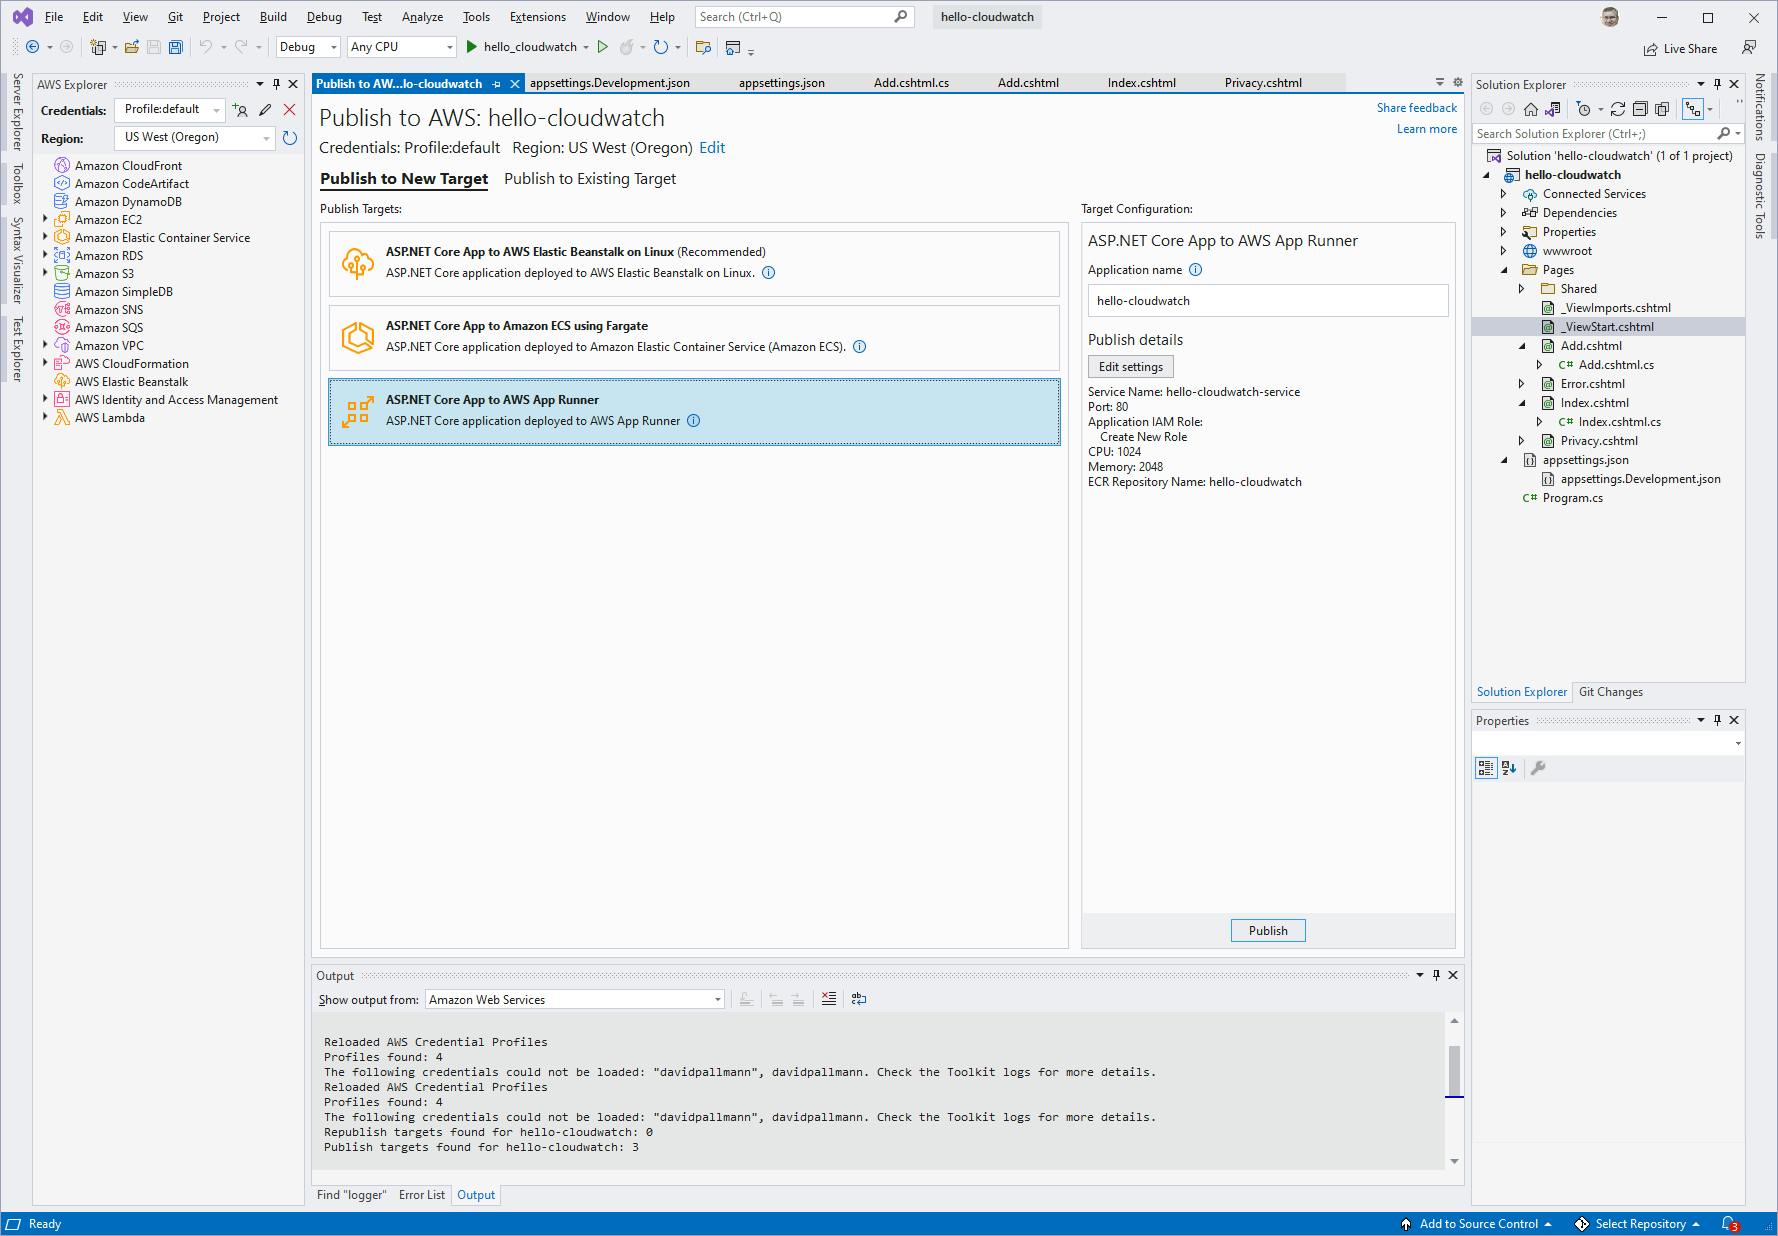
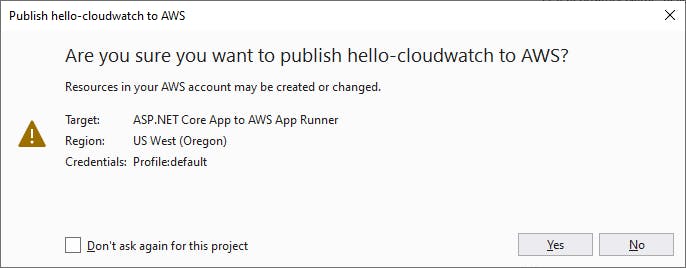
At lower right, click Publish and confirm the Are you sure you want to publish to AWS? dialog.
Wait for publishing to complete, and record the endpoint, which will be of the form
https://xxxxxxxxxx.us-west-2.awsapprunner.com/.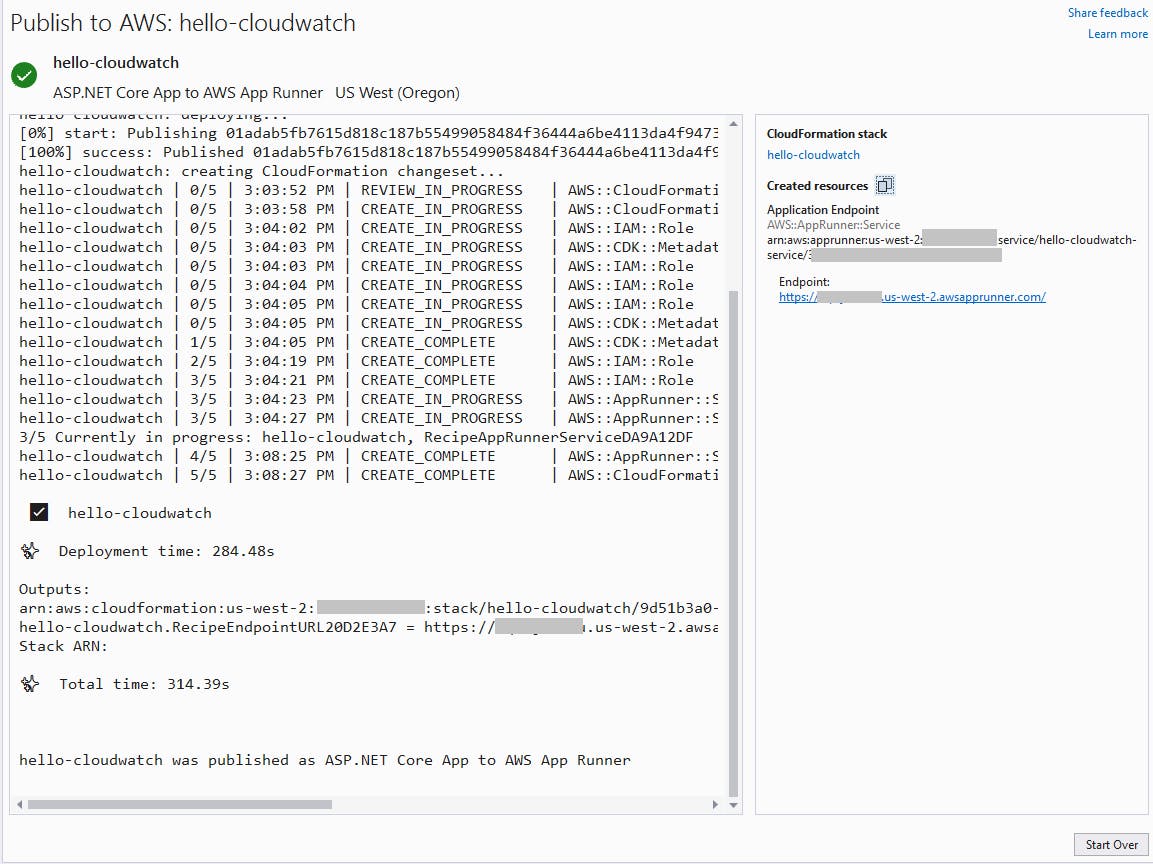
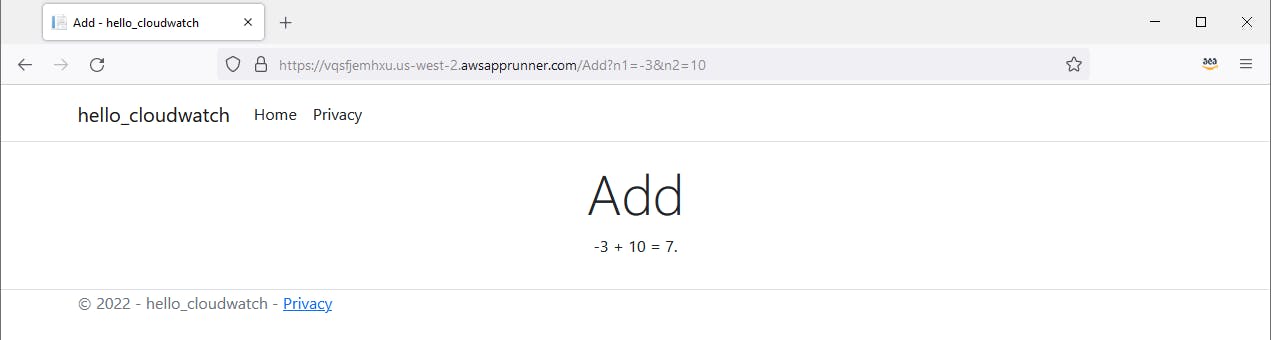
Step 4: Test on AWS
In this step, you'll test your web app on AWS and view CloudWatch logs and metrics in the AWS management console.
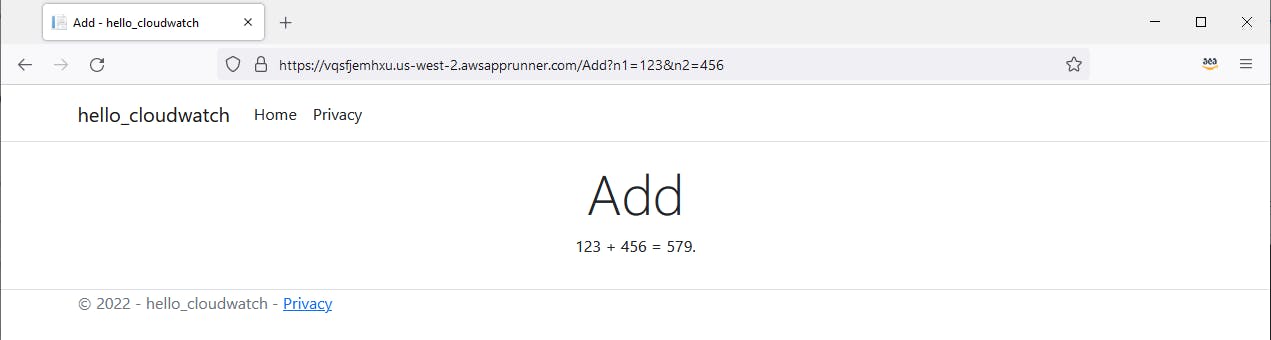
In a browser, visit the endpoint, adding
Add?n123=1&n2=456to the path:
Hit the page a few more times, with different values.
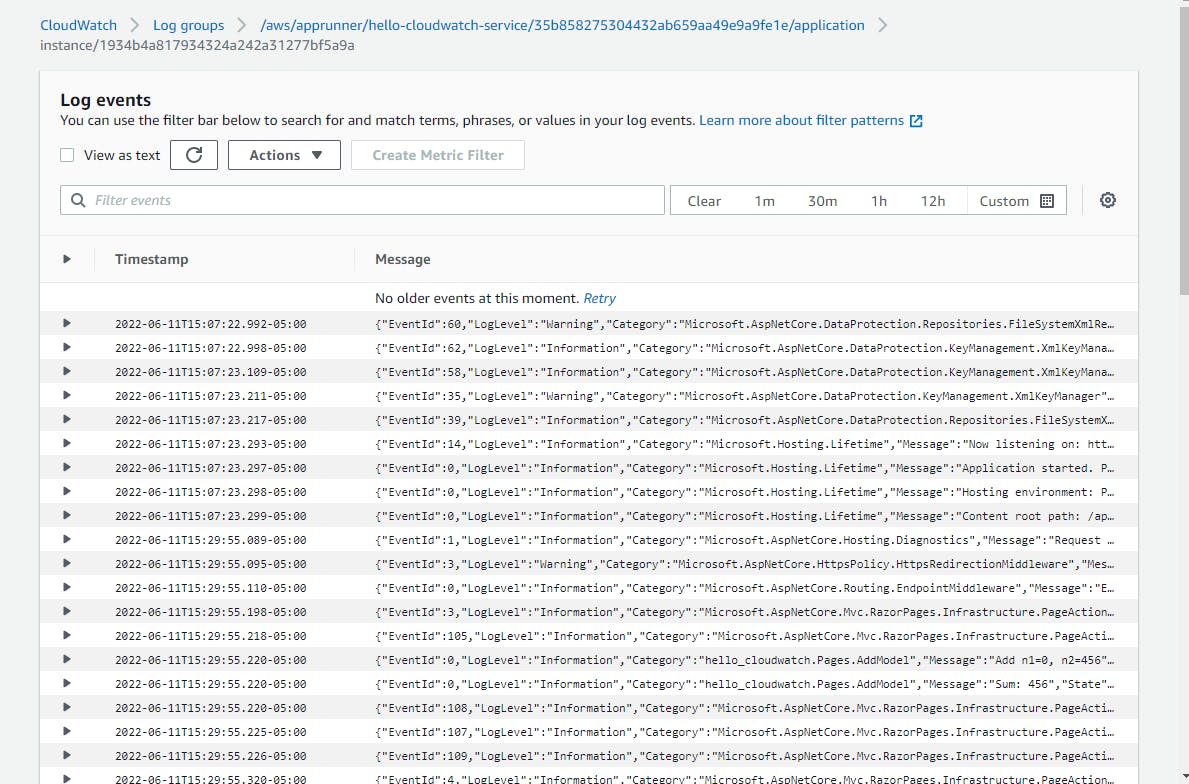
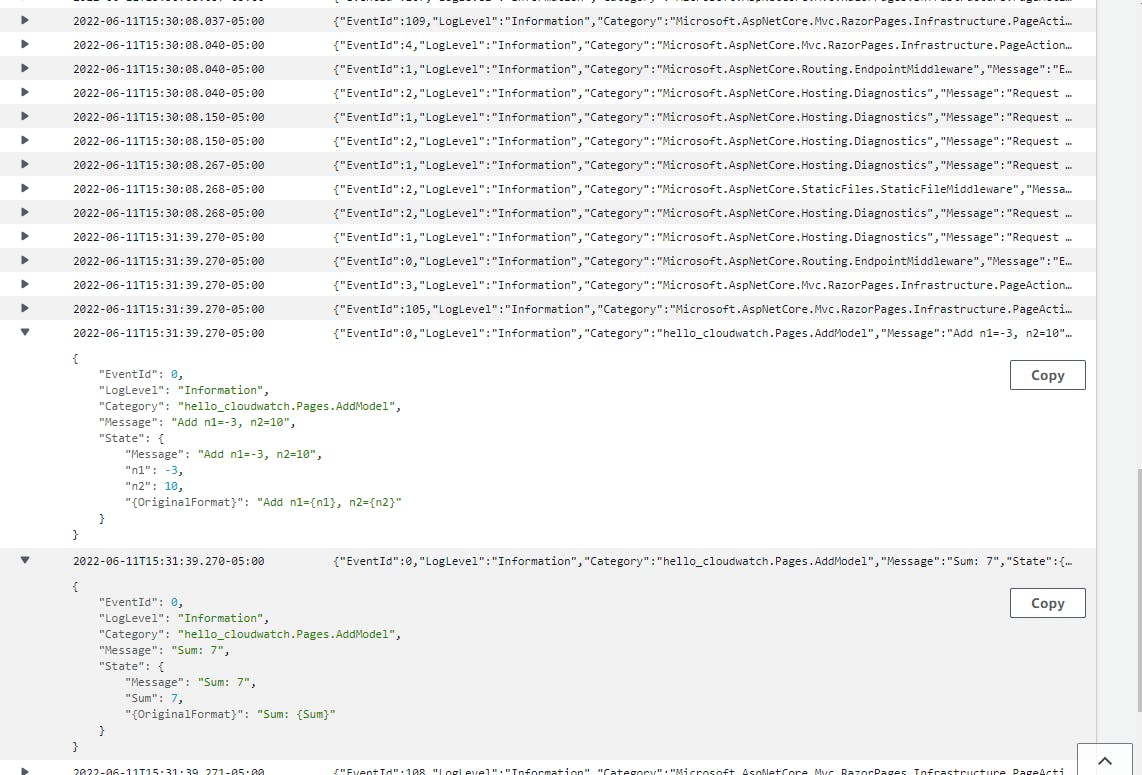
In the AWS console, navigate to Amazon CloudWatch and select Log Groups in the left pane. Now you see log groups for /aws/apprunner/hello-cloudwatch/.../application, which include a unique identifier for log stream. Click into the top-most log group, then click on the top-most log stream. The log contains many entries, most of which are generated by ASP .NET.

Scroll down and look through the logs, and you will also see the log messages you added to the Add page, which you can expand to see detail.
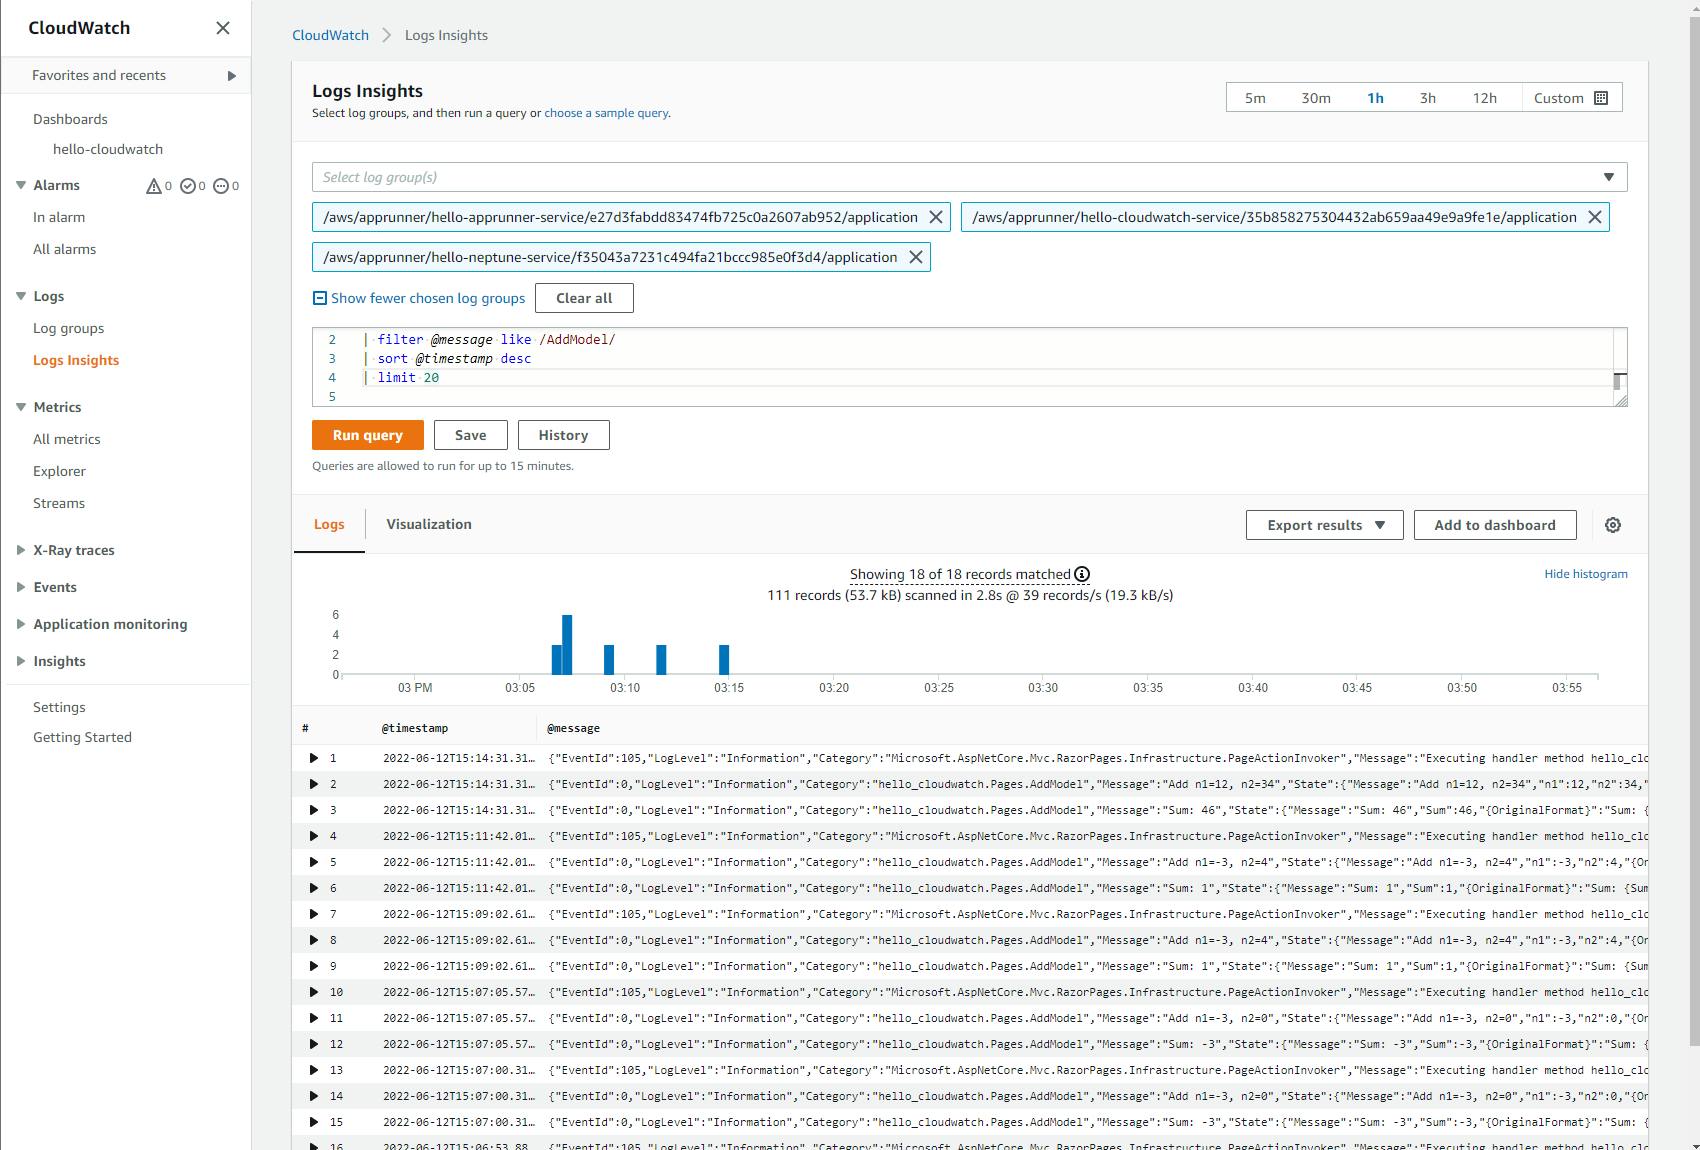
We can query logs to filter messages down to the ones we care about using a feature called Logs Insights. Let's filter down to just the messages written by our Add page:
A. On the left pane, select Logs Insights.
B. In the selection window, select each /aws/apprunner/hello-cloudwatch/.../application log group.
C. In the query window, enter the query below, which will only include messages from our Add page.
fields @timestamp, @message
| filter @message like /AddModel/
| sort @timestamp desc
| limit 20
D. Click Run query. You now see filtered log messages. If you were investigating an issue, Logs Insights queries are how you would locate exceptions or a problem area.
Navigate to AWS App Runner.
Select hello-cloudwatch-service to views its detail and select the Metrics tab. You see charts of CloudWatch metrics from App Runner. Select a time period that includes your test runs.
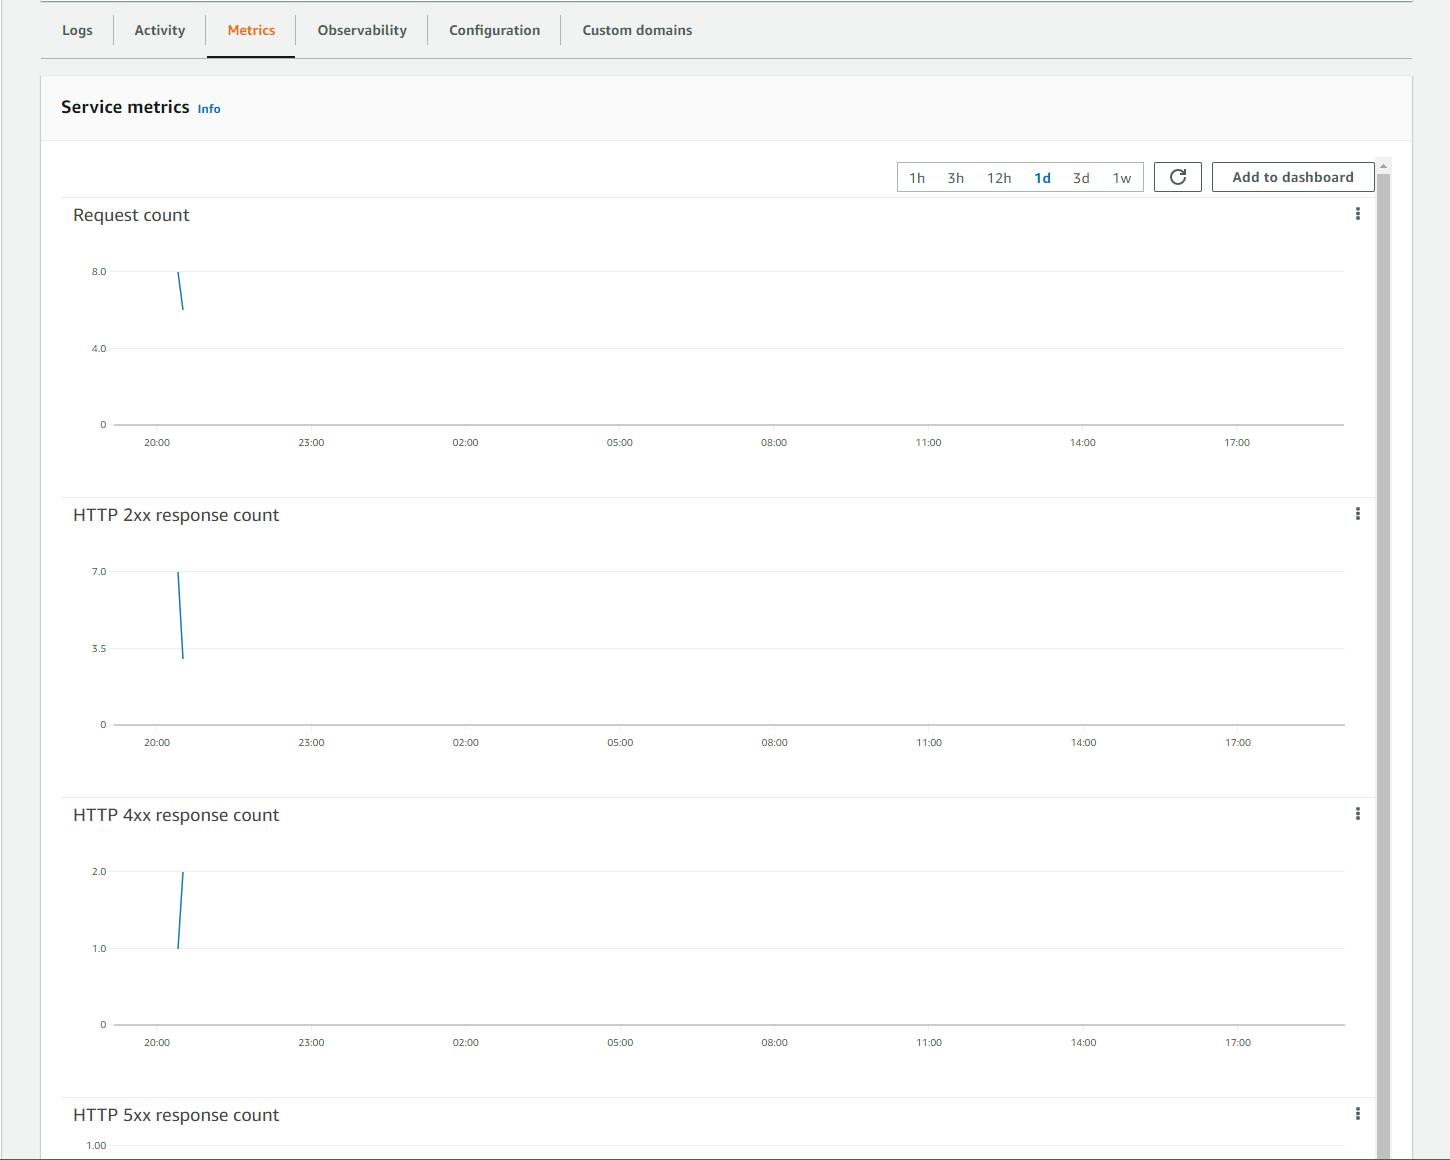
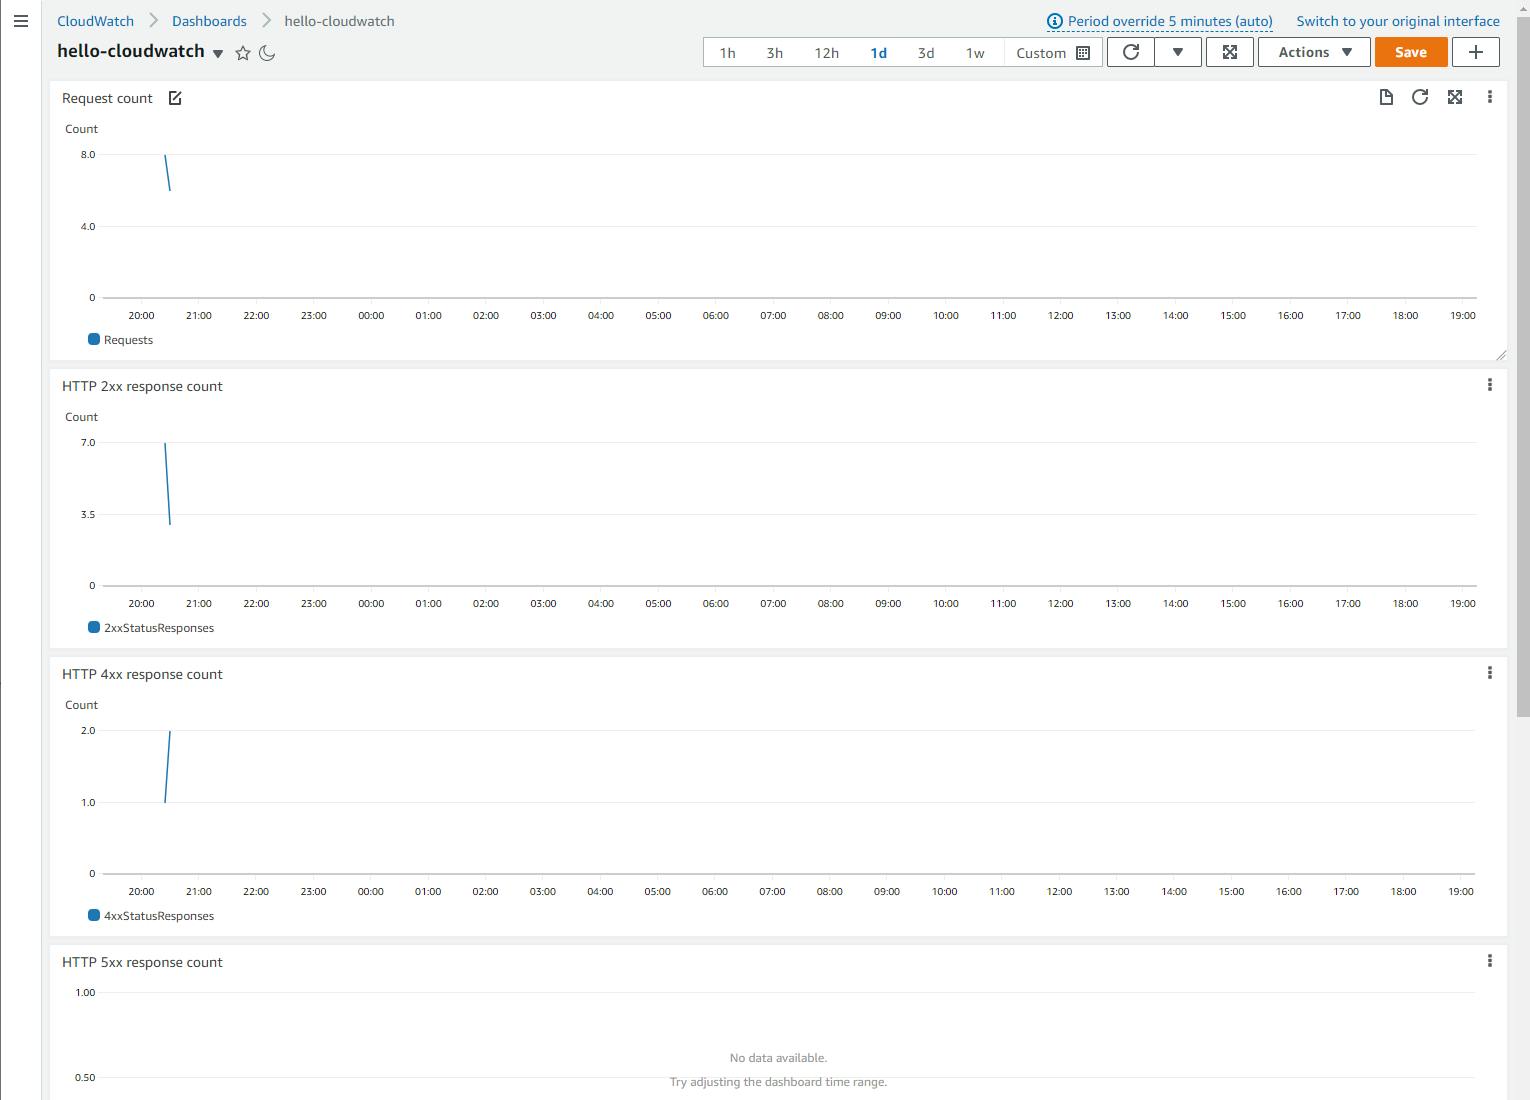
We can also view these metrics from the CloudWatch area of the management portal, by adding them to a custom dashboard.
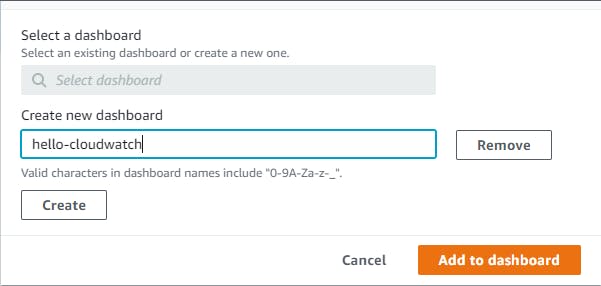
A. At the top right of the Service Metrics pane, click Add to dashboard
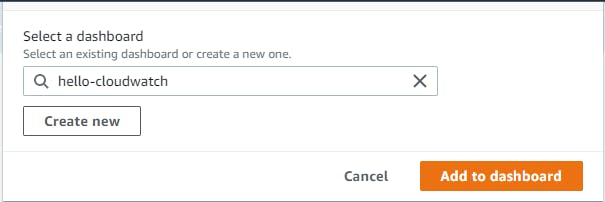
B. When the Select a dashboard prompt appears, click Create new.
C. Enter name hello-cloudwatch and click Create.
D. Click Add to dashboard and then Save.
E. Now you have a new dashboard in the CloudWatch section of the AWS console. This allows you to view both your logs and App Runner metrics all from the CloudWatch area.
Congratulations! You've deployed a web app to AWS App Runner, and used CloudWatch to view metrics from App Runner, and logs from your project.
Step 5: Shut it Down
When you're done with the Hello, CloudWatch project, follow these steps to delete the hello-cloudwatch project. You don't want to be charged for something you're not using.
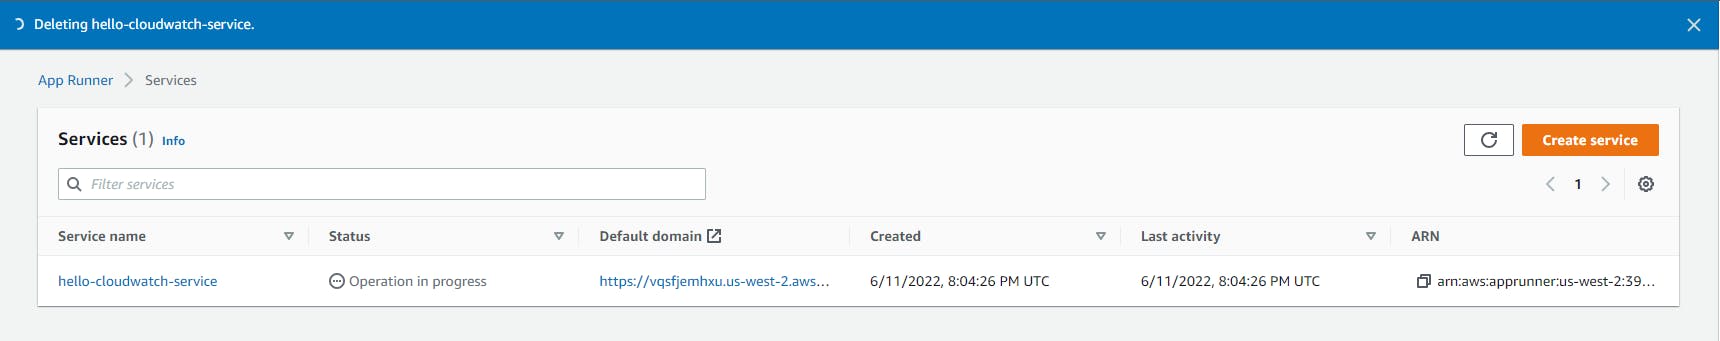
In the AWS management console, navigate to AWS App Runner.
Click the hello-cloudwatch service.
Choose Delete from the Actions menu and confirm the delete dialog.
Where to Go From Here
In this tutorial, you created a simple web application and instrumented it for storing ASP .NET Core Logging on AWS CloudWatch. You deployed the website to AWS App Runner. You viewed logs in CloudWatch and saw the log messages from ASP .NET and your own logging statements. You learned how to filter logs with Logs Insights. You also viewed App Runner metrics, and added them to a CloudWatch dashboard.
There's plenty more CloudWatch can do. This tutorial did not touch on publishing custom metrics or CloudWatch events. To go further, get familiar with CloudWatch features and try them with increasingly complex applications. Use CloudWatch with your preferred logging system for .NET.
CloudWatch is not the only AWS service for monitoring and observability. Review the full set of AWS service options for monitoring and observability and determine which might be useful for your applications. For example, AWS X-Ray is a distributed tracing system that helps analyze distributed systems and integrates with CloudWatch.
Further Reading
AWS Documentation
CloudWatch Logs Insights query syntax
Amazon CloudWatch - Graphic metrics
Amazon CloudWatch - Publishing custom metrics
Amazon CloudWatch - Using Metric Math
AWS SDK for .NET Documentation
Videos
The simplest way to build scheduling in .NET with AWS by Nick Chapsas
Logging .NET to AWS CloudWatch: Using Serilog by Ivan Kahl
Using CloudWatch with .NET Log4Net and NLog by Thorr Giddings
Log .NET 6 API to CloudWatch with NLog by Wes Doyle
Logging, Debugging & Monitoring .NET Applications on AWS by Sriwantha Attanayake
Amazon Web Services CloudWatch with AWS SDK for .NET C# by Mathis McCabe
Blogs
Metrics, tracing, and logging by Peter Bourgon
CloudWatch Dashboards - Create & Use Customized Metrics Views
How to Log Correctly to AWS CloudWatch from a .NET Application by Rahul Nath
Publish Metrics to CloudWatch in ./NET Core by Stuart Blacker
Blending Metrics Using Event Counters in C# by Stuart Blackler